
We’ve received two interesting letters from the school district last week. One was to let us know that Caitlyn scored well during testing last spring and would we like to consider doing more testing? The other was a notice about how the district isn’t doing so well according to the standards established by No Child Left Behind.
According to the letter, school districts need to meet a set standard (which was left undefined) in up to 111 categories to qualify as making “Adequate Yearly Progress”. (Is it progress if you meet the standard two years in a row? Or is that Adequate Yearly Stasis?) The goal is to have “all students meet or exceed state standards in reading and math.” The letter doesn’t define the standards, nor does it provide a footnote to tell me where I could go review the standards.
When I was in school, a million years ago and a couple states away, I heard a lot about The Curve, mostly from my peers. Sure, the teachers mentioned it in passing as a grading method, but it was my peers who asked about it all the time, confirming it’s use, determining who had the score that “broke” The Curve, knowing their place on it.
The Curve looks like this (image from EconomicsHelp)
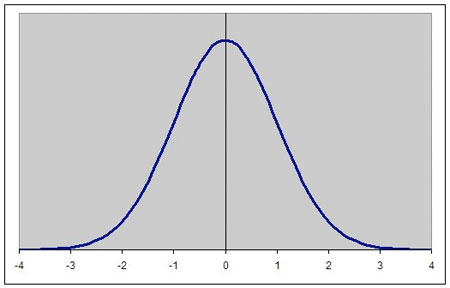
I never took a class in statistics. There’s lots here I don’t understand. I do know about averages, though. Take a group, total it, divide by the number of group members. If you plot out the individuals in the group, you’ll usually get something that looks like the curve above. It represents something called a Normal Distribution. The idea is that, in a group, most characteristics (speed, size, intelligence, skill, coloring, etc) of the individuals in that group will fall into this pattern. Most of them will be average, at or around the peak of the curve, with some falling above or below average, tapering off to almost nothing at the extremes. There will always be a swallow who can fly faster than 24 mph, but most swallows will fly at or about that speed.
Unless something fundamental has changed in the last 20-odd years, Normal Distribution and the Bell Curve are still valid concepts. If so, then there is a very basic problem with the goal that “all students (will) meet or exceed state standards in reading or math.” Either the goal itself is unachievable, since there will always be some students who are at the extreme back side of The Curve, or the standards are set so low as to be completely meaningless, since they would need to be something that every student, regardless of ability, could meet. Either No Child Left Behind is set up so that all schools and districts must eventually fail or the standards have been downgraded so that everyone can pass, translating to an educational system that doesn’t even come close to adequately educating the majority of it’s students.
At least one of the problems here is the unfashionable-ness of admitting that individual people are truly unique. Oh, sure, there’s the general celebration of No One Will Ever Be Just Like You. We are all Unique and Beautiful Snowflakes. But it’s not appropriate now to have an educational system that outwardly acknowledges that some children may be more or less intelligent than average. Someone’s self-esteem might be injured. Or that some children may have extra-curricular access to supplemental resources. That would mean acknowledging socioeconomic differences. The result is a system that will ultimately leave every child it serves equally uneducated.
As a result of not achieving Adequate Yearly Progress, the district is now required to take a fixed portion of its federal funding and use it for “focused professional development for teachers and administrators.” That’s money that perhaps could be used more directly for the benefit of the students, now reallocated out of the idea that it’s not the fault of the system or of our culture’s inability to acknowledge and constructively deal with individual differences, but the fault of poorly trained teachers. If only the teachers could teach better, then they could simultaneously teach 30 children to pass a specific test, regardless of individual ability or situation. It’s really no wonder that more and more curricula are about the tests, at the expense of science, art, music, social studies and recess.
I used to think that 'the curve' was the natural thing in a class until I started teaching at Uni and realised that as much as the admin might like them, the classes rarely went that direction. What we usually had, particularly in first year where you might expect the greatest spread in abilities and motivation, was a double curve (can't remember the right term). The largest portion of the curve was fairly high, with a B or B+ average and a very sharp drop-off after that. Then there was a gap and a smaller curve formed by C- down to complete and utter fails. It's that group who spoils the averages and if you try and shoehorn the marks onto a normal curve then you miss the reality of the situation. Spend the money on that small group and the whole will improve dramatically. Pretending they're not there, for whatever reason, kind of misses the point, but like you say, society is now so wedded to the idea that everyone is potentially equal when they're not – no more than everyone can run as fast or draw or sing as well.
I figured I was unaware of some nuances to the classic curve as applied to test scores. Thanks for sharing! And yes, focusing resources on bringing up those on the back side of "the curve" probably would push the district into meeting AYP. I'm not sure the "focused professional development for teachers and administrators" actually translates to bringing that group forward, though. There's limited (financial) resources within the education system; tying up some of those resources in something that looks good on paper (more training!) results in less resources being available for actual contact with actual children.